Integrating Telemetry in Llama Stack for Tracing, Metrics, and Logging
Goal
In this module, you’ll explore how to enable and use the telemetry system built into Llama Stack. This includes configuring sinks such as OpenTelemetry, SQLite, and console output, as well as understanding the different types of events (logs, metrics, spans) emitted by the system.
Prerequisites
-
Llama model loaded and running (see: Llama-stack Helloworld)
-
Python 3.10+ installed on your local machine
-
Python virtual environment setup and activated (see: Llama-stack Helloworld)
Telemetry in Llama Stack
Llama Stack includes a built-in telemetry system that offers detailed observability into your AI workloads through tracing, metrics, and logging. It allows developers and operators to better understand model behavior, monitor performance, and debug issues effectively.
Key Concepts
-
Spans: A span represents a single operation within a system, capturing information such as start time, duration, and contextual metadata. Spans can be nested to represent parent-child relationships between operations.
-
Traces: A trace is a collection of spans that together represent the execution flow of a single request or task, providing a full picture of how a process unfolds across components.
Supported Telemetry Sinks
The Llama Stack telemetry system can export data to several destinations, known as sinks. These include:
-
OpenTelemetry (OTel): Sends traces and metrics to an OpenTelemetry Collector, which can be visualized in tools like Jaeger or Grafana. Useful for real-time observability across distributed systems.
-
SQLite: Stores telemetry events locally in a SQLite database file.
-
Console: Prints logs, spans, and metrics directly to the terminal or standard output. This is particularly helpful during development or for debugging locally.
Step 1: Install Jaeger for Tracing
To visualize telemetry data such as traces, we will use Jaeger, a popular distributed tracing system. The Llama Stack’s OTel (OpenTelemetry) sink is compatible with the OpenTelemetry Collector, and it exposes separate endpoints for traces and metrics.
In this step, you’ll start a local Jaeger instance with:
-
The OTLP HTTP trace endpoint listening on port
4318 -
The Jaeger UI accessible at
http://localhost:16686 -
The Jaeger Collector enabled to receive traces via OTLP
Run the following command to launch Jaeger using Podman:
podman run --rm --name jaeger \
           -p 16686:16686 -p 4318:4318 \
           -e COLLECTOR_OTLP_ENABLED=true \
           -e COLLECTOR_OTLP_HTTP_ENABLED=true \
           jaegertracing/jaeger:2.1.0
Once running, open your browser and navigate to http://localhost:16686 to access the Jaeger UI and begin visualizing your traces. From here, you can search for traces, view their details, and analyze the performance of your Llama Stack applications.
But first, you need to start the Llama Stack server with telemetry enabled. So be patient and follow the next steps to set up the Llama Stack server with telemetry features.
Step 2: Start the Llama Stack Server with Telemetry Enabled
To enable telemetry in Llama Stack, you need to start the Llama Stack server with some specific runtime configurations. The Llama Stack runtime configuration can be specified as a YAML file.
First, export the necessary environment variables:
export LLAMA_STACK_MODEL="meta-llama/Llama-3.2-3B-Instruct"
export INFERENCE_MODEL="meta-llama/Llama-3.2-3B-Instruct"
export LLAMA_STACK_PORT=8321
export LLAMA_STACK_SERVER=http://localhost:$LLAMA_STACK_PORT
Next, download the Llama Stack runtime configuration file from the repository. This file contains the necessary settings to enable telemetry features such as OpenTelemetry, SQLite, and console logging:
wget https://raw.githubusercontent.com/rh-aiservices-bu/llama-stack-tutorial/main/apps/telemetry/run-otel.yaml -O ~/run-otel.yaml
export LLAMA_STACK_CONFIG_FILE=~/run-otel.yaml
Now run the Llama Stack container using Podman. This command will start the server with the specified model and configuration file, enabling telemetry features:
podman run -it --rm \
  -p $LLAMA_STACK_PORT:$LLAMA_STACK_PORT \
  -e INFERENCE_MODEL=$LLAMA_STACK_MODEL \
  -e OLLAMA_URL=http://host.containers.internal:11434 \
  -v $LLAMA_STACK_CONFIG_FILE:/root/my-run.yaml:ro \
  llamastack/distribution-ollama:0.2.9 \
  --port $LLAMA_STACK_PORT \
  --yaml-config /root/my-run.yaml
The Llama Stack server will start and listen on port 8321.
Check that the server is running using the llama-stack-client to send your first prompt using the CLI:
llama-stack-client \
  inference chat-completion \
  --message "hello, what is OpenTelemetry?" \
  --model-id "meta-llama/Llama-3.2-3B-Instruct"
Step 3: Telemetry Llama-Stack Configuration
The telemetry configuration is specified in the Llama Stack runtime configuration file. This file defines the sinks to which telemetry data will be sent, such as OpenTelemetry, SQLite, and console output.
You can configure one or more sinks, depending on your observability requirements. Supported sinks include:
-
console– prints telemetry output to the terminal. -
sqlite– stores telemetry data in a local SQLite database. -
otel_trace/otel_metric– sends data to an OpenTelemetry Collector (e.g., Jaeger, Prometheus).
Here’s an example that sends telemetry signals to Console Output and OpenTelemetry used in this example. Your configuration might use one or more sinks, depending on your needs:
  telemetry:
  - provider_id: meta-reference
    provider_type: inline::meta-reference
    config:
      sinks: ['console', 'sqlite', 'otel_trace', 'otel_metric']
      otel_trace_endpoint: "http://host.containers.internal:4318/v1/traces"
      otel_metric_endpoint: "http://host.containers.internal:4318/v1/metrics"
      sqlite_db_path: "/var/tmp/telemetry.db"
To know more, check the LLamaStack Configuration Documentation.
Step 4: Testing Llama Stack Console Telemetry
Run this command to create a file called test_console_telemetry.py:
cat << 'EOF' > test_console_telemetry.py
import os
import json
import os
import json
from datetime import datetime, timezone
from termcolor import colored
from rich.pretty import pprint

from llama_stack_client import LlamaStackClient
from llama_stack_client.lib.agents.agent import Agent
from llama_stack_client.lib.agents.event_logger import EventLogger
from llama_stack_client.types.agent_create_params import AgentConfig

# Initialize client
host = "localhost"
port = 8321
client = LlamaStackClient(base_url=f"http://{host}:{port}")

# List available shields
available_shields = [shield.identifier for shield in client.shields.list()]
if not available_shields:
    print(colored("No available shields. Disabling safety.", "yellow"))
else:
    print(f"Available shields found: {available_shields}")

# List available models
available_models = [
    model.identifier for model in client.models.list() if model.model_type == "llm"
]
if not available_models:
    print(colored("No available models. Exiting.", "red"))
    exit()
else:
    selected_model = available_models[0]
    print(f"Using model: {selected_model}")

# Agent config
agent_config = AgentConfig(
    model=selected_model,
    instructions="You are a helpful assistant",
    sampling_params={
        "strategy": {"type": "top_p", "temperature": 1.0, "top_p": 0.9},
    },
    toolgroups=[
        "builtin::code_interpreter",
    ],
    tool_choice="auto",
    input_shields=available_shields,
    output_shields=available_shields,
    enable_session_persistence=False,
)

# Create agent and session
agent = Agent(client, agent_config)
session_id = agent.create_session("test-session")

# Run prompts
user_prompts = [
    "Write a Python function to calculate the factorial of a number.",
]

for prompt in user_prompts:
    response = agent.create_turn(
        messages=[{"role": "user", "content": prompt}],
        session_id=session_id,
    )

    for log in EventLogger().log(response):
        log.print()

## TELEMETRY ## -> print trace spans for session
print(f"\n📡 Getting traces for session_id={session_id}")
agent_logs = []

for span in client.telemetry.query_spans(
        attribute_filters=[
            {"key": "session_id", "op": "eq", "value": session_id},
        ],
        attributes_to_return=["input", "output"],
):
        if span.attributes["output"] !=º "no shields":
            agent_logs.append(span.attributes)

print("\n📋 Here are examples of traces:")
pprint(agent_logs[:2])
EOF
The test_console_telemetry.py script does the following:
-
Connects to the Llama Stack server
-
Lists available shields and models
-
Creates an agent with safety shields and tool access
-
Sends a prompt to the agent
-
Logs and prints telemetry data associated with the request
-
Retrieves spans linked to the session and prints trace data
Step 5: Test the Telemetry Script
To test the telemetry integration, you can run the provided Python script test_console_telemetry.py. As described before, this script will interact with the Llama Stack server, send a prompt, and print out the telemetry data collected during the session.
Install the Llama Stack Client SDK if you haven’t already:
pip install llama-stack-client==0.2.8Then run the script:
chmod +x test_console_telemetry.py
python test_console_telemetry.py localhost 8321
You should see output similar to the following, which includes the telemetry data collected during the session:
inference> This function uses recursion to calculate the factorial of a number. It works by multiplying the input number `n` with the factorial of `n-1`. If `n` is 0, it returns 1 (since the factorial of 0 is defined as 1).
Please note that this recursive implementation has an exponential time complexity due to repeated computations in each recursive call. For larger numbers, an iterative solution would be more efficient using a loop to avoid redundant calculations.
📡 Getting traces for session_id=a75ee999-5c9c-425f-84d2-2643ad809850
📋 Here are examples of traces:
[
│ {
│ │ 'input': '[{"role": "system", "content": "You are a helpful assistant"}, {"role": "user", "content": "Write a Python function to calculate the factorial of a number.", "context": null}]',
│ │ 'output': '{"content": "", "tool_calls": [{"call_id": "4b545590-cddd-4513-8112-080ca508c4dd", "tool_name": "code_interpreter", "arguments": {"code": "def factorial(n):\\n if n == 0:\\n return 1\\n else:\\n return n * factorial(n-1)"}, "arguments_json": "{\\"code\\": \\"def factorial(n):\\\\n if n == 0:\\\\n return 1\\\\n else:\\\\n return n * factorial(n-1)\\"}"}]}'
│ },
│ {
│ │ 'input': '{"role":"assistant","content":"","stop_reason":"end_of_turn","tool_calls":[{"call_id":"4b545590-cddd-4513-8112-080ca508c4dd","tool_name":"code_interpreter","arguments":{"code":"def factorial(n):\\n if n == 0:\\n return 1\\n else:\\n return n * factorial(n-1)"},"arguments_json":"{\\"code\\": \\"def factorial(n):\\\\n if n == 0:\\\\n return 1\\\\n else:\\\\n return n * factorial(n-1)\\"}"}]}',
│ │ 'output': '{"role":"tool","call_id":"4b545590-cddd-4513-8112-080ca508c4dd","content":"completed\\n[stderr]\\nbwrap: Creating new namespace failed, likely because the kernel does not support user namespaces. bwrap must be installed setuid on such systems.\\n[/stderr]"}'
│ }
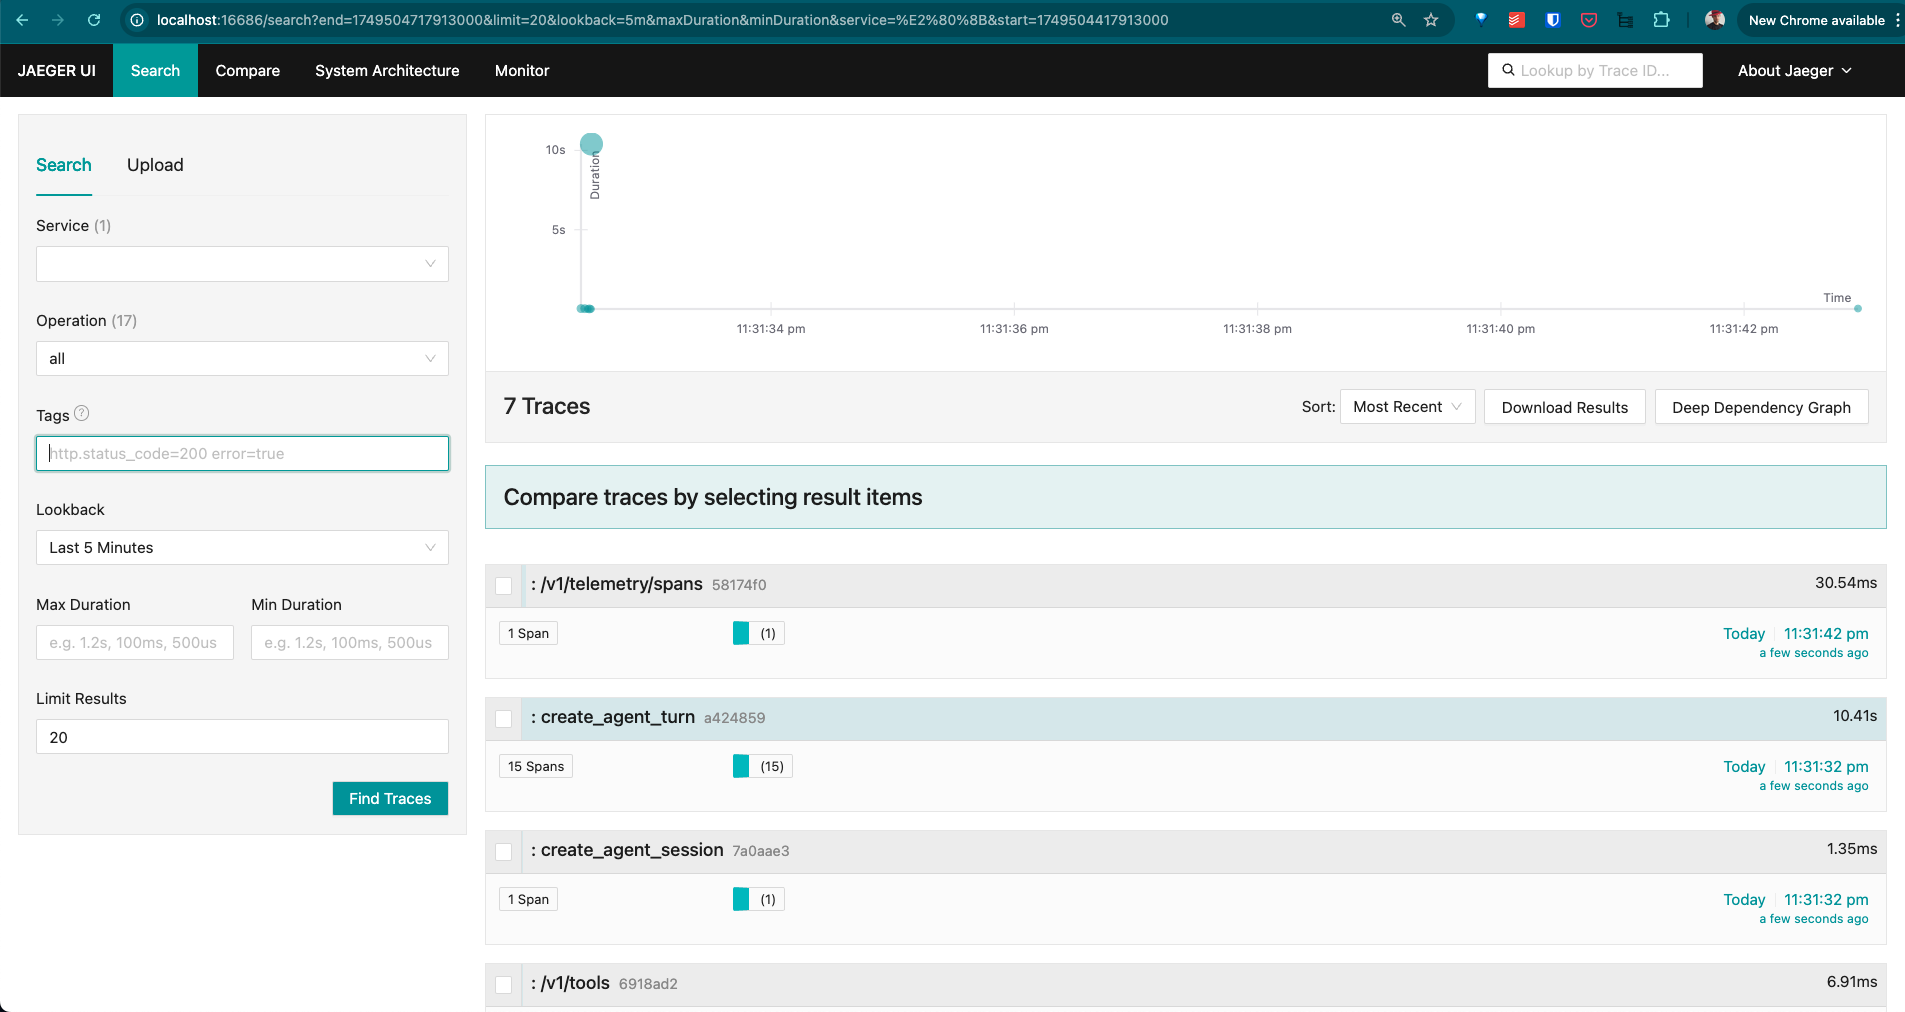
]Step 6: Explore the Telemetry Data in Jaeger
Now that you have run the telemetry script, you can visualize the trace data in Jaeger.
-
1. Open your browser and navigate to
http://localhost:16686. -
2. In the Jaeger UI, check the Service and modify the Lookback for the last 5/15 minutes.
-
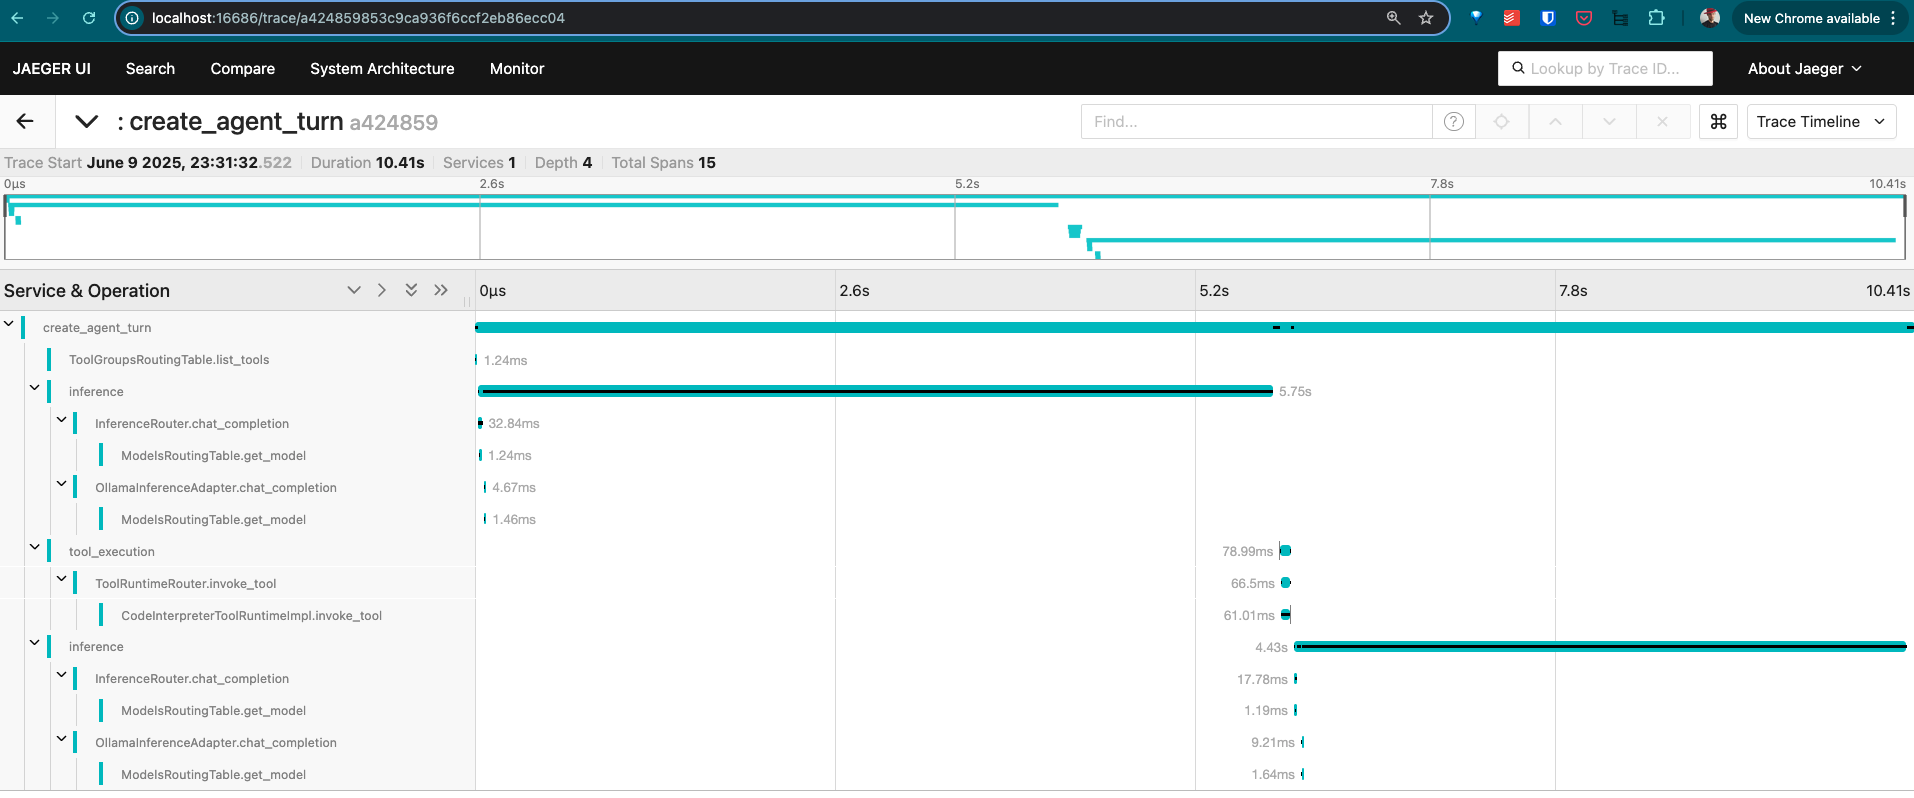
3. Click on the
create_agent_turnspan to view the trace details:
-
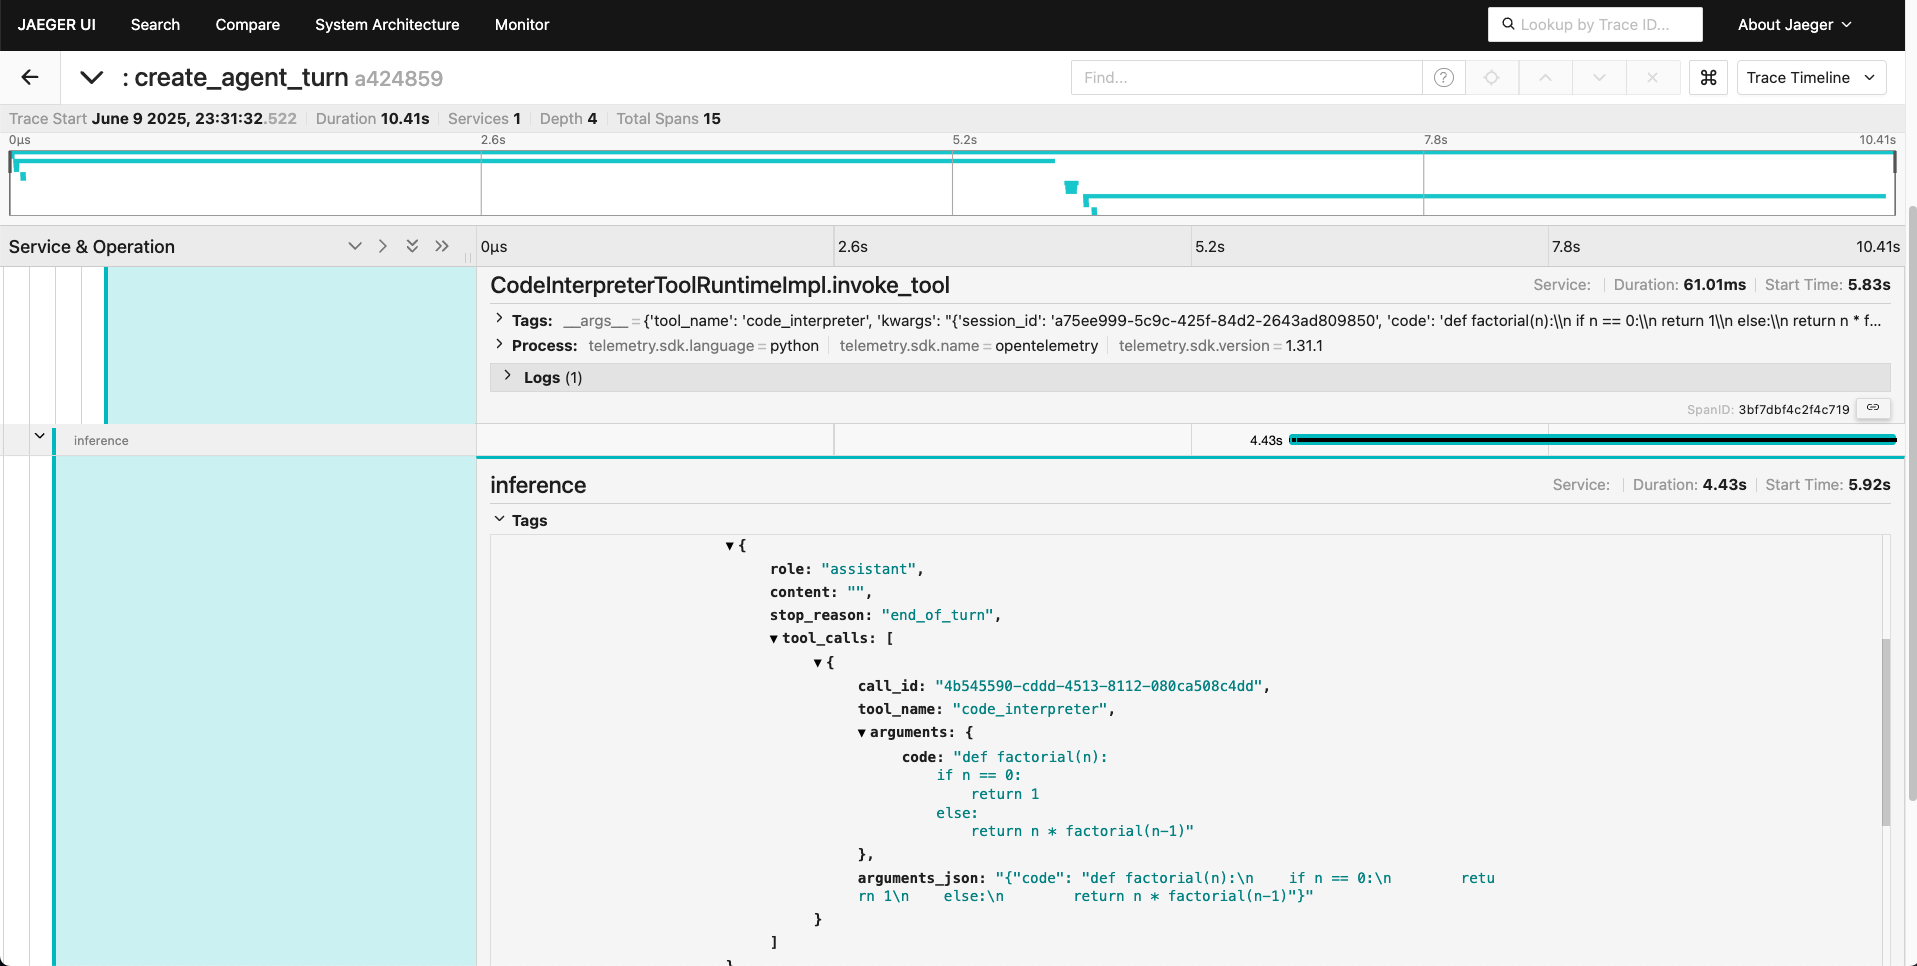
4. Click on a trace to view its details, including spans, logs, and metrics:
Summary
In this module, you:
-
Set up Jaeger to visualize trace data from the Llama Stack
-
Configured the Llama Stack server to emit telemetry to multiple sinks (console, SQLite, OpenTelemetry)
-
Explored the telemetry system’s core concepts: spans, traces, logs, and metrics
-
Used the Llama Stack Client SDK to send prompts and analyze the generated telemetry
-
Retrieved span data for a session and attached custom telemetry events
-
Visualized the telemetry data in Jaeger to understand the execution flow and performance of your AI applications
This telemetry integration provides the observability backbone necessary for production-grade AI applications, enabling enhanced debugging, monitoring, and auditing capabilities.